One Rep Max Calculator (1RM)
By Hilly Shore Labs Updated
Your one rep max is estimated by multiplying a hard set's weight by a rep factor. Epley's formula, weight × (1 + 0.0333 × reps), turns 225 lb for 5 reps into about 262 lb; Brzycki's gives about 253 lb and Lombardi's about 264 lb. Sets of 10 reps or fewer give the most reliable estimate.
Estimated squat 1RM · 225 lb × 5
260 lb
Average of the three formulas. They span 253–264 lb.
- Epley262lb
- Brzycki253lb
- Lombardi264lb
Runs in your browser. Nothing you enter is stored or sent.
Training weights from your 260 lb 1RM
Reps column: the NSCA Training Load Chart's max reps at that percentage. Tap a row to load it on the bar.
| %1RM | Weight | NSCA reps | Load |
|---|---|---|---|
| 100% | 260 lb | 1 | |
| 95% | 247 lb | 2 | |
| 93% | 242 lb | 3 | |
| 90% | 234 lb | 4 | |
| 87% | 226 lb | 5 | |
| 85% | 221 lb | 6 | |
| 83% | 216 lb | 7 | |
| 80% | 208 lb | 8 | |
| 77% | 200 lb | 9 | |
| 75% | 195 lb | 10 | |
| 70% | 182 lb | 12 | |
| 65% | 169 lb | — | |
| 60% | 156 lb | — | |
| 55% | 143 lb | — | |
| 50% | 130 lb | — |
Plates per side
Your estimated 1RM · target 260 lb
- 45
- 35
- 25
- 2.5
107.5 lb each side + 45 lb bar = 260 lb.
Assumes you own enough pairs of each ticked plate. Collars are not counted; bar weights vary by maker, so use your bar's stated weight.
The three 1RM formulas
Each formula takes the weight of a set taken to failure and the number of reps, and returns an estimated one-rep max. The equations below are written as tabulated by Lin et al. (2021, from LeSuer et al. 1997) and Beia et al. (2024). A single rep is already a 1RM, so the calculator returns the weight unchanged at 1 rep.
Epley
1RM = weight × (1 + 0.0333 × reps)
Richens and Cleather (2014) describe it as a poundage chart, not based on scientific research.
Original: Epley B. Poundage Chart. Boyd Epley Workout. Lincoln, NE: Body Enterprises; 1985.
Brzycki
1RM = 100 × weight ÷ (102.78 − 2.78 × reps)
Mayhew et al. (1995) found it the most accurate of six equations for bench press sets of 10 reps or fewer.
Original: Brzycki M. Strength testing: predicting a one-rep max from reps-to-fatigue. J Phys Educ Recreat Dance. 1993;64(1):88–90.
Lombardi
1RM = weight × reps^0.10
A power curve that flattens as reps rise: the highest estimate of the three at 2 to 5 reps and the lowest from 8 reps up.
Original: Lombardi VP. Beginning Weight Training. Dubuque, IA: W.C. Brown; 1989.
The calculator's headline number is the average of the three, following Mayhew et al.'s (1995) suggestion that averaging equations may reduce the error.
1RM factors by reps, 1 to 12
Multiply the weight you lifted by the factor to get the estimate. The percentage is the same thing read the other way: the share of your 1RM that a set of that many reps represents. The last column is the NSCA Training Load Chart, which publishes 1 to 10 and 12 reps.
| Reps | Epley factor / %1RM | Brzycki factor / %1RM | Lombardi factor / %1RM | NSCA %1RM |
|---|---|---|---|---|
| 1 | × 1.000 / 100.0% | × 1.000 / 100.0% | × 1.000 / 100.0% | 100% |
| 2 | × 1.067 / 93.8% | × 1.029 / 97.2% | × 1.072 / 93.3% | 95% |
| 3 | × 1.100 / 90.9% | × 1.059 / 94.4% | × 1.116 / 89.6% | 93% |
| 4 | × 1.133 / 88.2% | × 1.091 / 91.7% | × 1.149 / 87.1% | 90% |
| 5 | × 1.167 / 85.7% | × 1.125 / 88.9% | × 1.175 / 85.1% | 87% |
| 6 | × 1.200 / 83.3% | × 1.161 / 86.1% | × 1.196 / 83.6% | 85% |
| 7 | × 1.233 / 81.1% | × 1.200 / 83.3% | × 1.215 / 82.3% | 83% |
| 8 | × 1.266 / 79.0% | × 1.242 / 80.5% | × 1.231 / 81.2% | 80% |
| 9 | × 1.300 / 76.9% | × 1.286 / 77.8% | × 1.246 / 80.3% | 77% |
| 10 | × 1.333 / 75.0% | × 1.334 / 75.0% | × 1.259 / 79.4% | 75% |
| 11 | × 1.366 / 73.2% | × 1.385 / 72.2% | × 1.271 / 78.7% | — |
| 12 | × 1.400 / 71.4% | × 1.441 / 69.4% | × 1.282 / 78.0% | 70% |
Shaded rows are sets above 10 reps, where the studies cited below found the estimates least reliable. The NSCA chart has no 11-rep column.
%1RM chart
Training weights at each percentage for common 1RMs, with the reps the NSCA Training Load Chart pairs with that percentage. Enter your own numbers in the calculator above for your table in pounds or kilograms.
| %1RM | NSCA reps | 135 lb 1RM | 185 lb 1RM | 225 lb 1RM | 275 lb 1RM | 315 lb 1RM | 405 lb 1RM |
|---|---|---|---|---|---|---|---|
| 100% | 1 | 135 | 185 | 225 | 275 | 315 | 405 |
| 95% | 2 | 128 | 176 | 214 | 261 | 299 | 385 |
| 93% | 3 | 126 | 172 | 209 | 256 | 293 | 377 |
| 90% | 4 | 122 | 167 | 203 | 248 | 284 | 365 |
| 87% | 5 | 117 | 161 | 196 | 239 | 274 | 352 |
| 85% | 6 | 115 | 157 | 191 | 234 | 268 | 344 |
| 83% | 7 | 112 | 154 | 187 | 228 | 261 | 336 |
| 80% | 8 | 108 | 148 | 180 | 220 | 252 | 324 |
| 77% | 9 | 104 | 142 | 173 | 212 | 243 | 312 |
| 75% | 10 | 101 | 139 | 169 | 206 | 236 | 304 |
| 70% | 12 | 95 | 130 | 158 | 193 | 221 | 284 |
| 65% | — | 88 | 120 | 146 | 179 | 205 | 263 |
| 60% | — | 81 | 111 | 135 | 165 | 189 | 243 |
| 55% | — | 74 | 102 | 124 | 151 | 173 | 223 |
| 50% | — | 68 | 93 | 113 | 138 | 158 | 203 |
The NSCA chart is a starting point, not a rule for every lifter: Richens and Cleather (2014) found endurance runners completed about 40 reps at 70% of their leg press 1RM against about 18 for weightlifters, and concluded that traditional guidelines may underestimate the reps possible at a given percentage.
How accurate are 1RM estimates?
- Fewer reps, better estimate. In 69 college football players doing reps at 225 lb, Whisenant et al. (2003) found all 11 equations they tested were more valid when fewer reps were completed.
- Past 10 reps, every equation drifts. Mayhew et al. (1995) tested six equations on 220 men's bench press: for sets of 10 reps or fewer Brzycki was the most accurate, and for sets above 10 reps three equations significantly over-predicted and three under-predicted 1RM.
- Averages help. The same study suggested that averaging two equations may reduce the error, which is why the calculator leads with the average of three.
- Population matters. Beia et al. (2024) found differences of up to 20% between predicted and actual leg press 1RM reported in earlier studies of older adults, and built new equations for that group.
In practice: use a recent set of 3 to 10 reps taken close to failure, and treat the result as a planning number for programming, not a measured max.
How plates per side works
- Round the target to a loadable number: whole pounds, or the nearest 0.5 kg.
- Subtract the bar weight and halve the rest. That is the weight on each sleeve.
- Find the combination of the plates you ticked that gets closest to it without going over, using the fewest plates. It searches every combination, so a set without 25s still finds the best load.
- If the exact weight isn't possible with your plates, it shows the closest load under the target and the next load up.
Example: 315 lb on a 45 lb bar is 135 lb per side, three 45 lb plates. With only 45s, 25s and 10s, a 300 lb target is 127.5 lb per side, which can't be loaded exactly; the closest is 125 lb a side (45 + 45 + 25 + 10), 295 lb in total.
Loading the bar at home
A bar, enough plates to reach your training weights and a rack to work from are the three things this calculator assumes. These are picks we rank in those categories:
- Bar
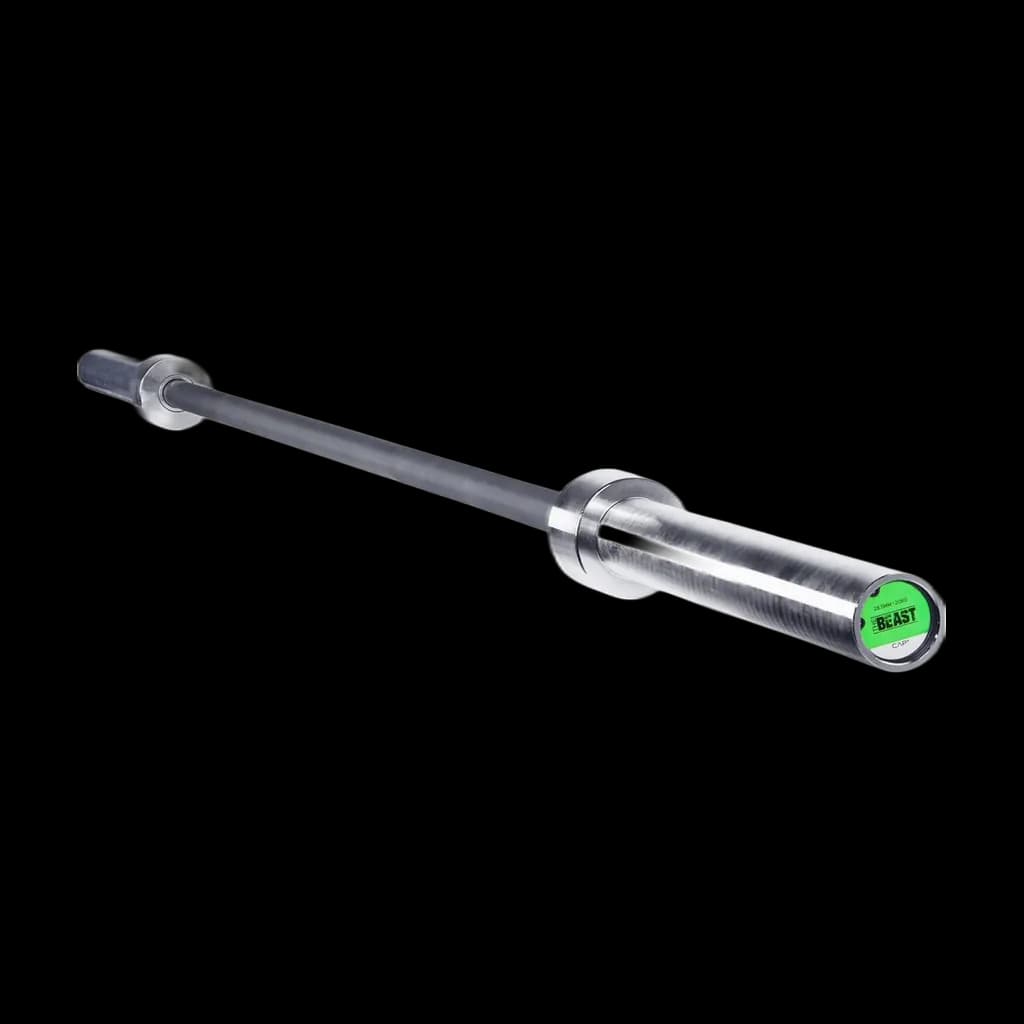
The Beast is what most people actually buy as their first 'real' barbell, and it earns the love. A 7 ft, 20 kg bar with no center knurl and bushing-driven sleeves; CAP rates it to 1,200 lb and 120,000 PSI tensile, which is more than any home lifter will load in this lifetime. The knurl is milder than Rogue's — fine for high-rep work, less ideal for max deadlifts without chalk. Fit-and-finish loses to Rogue and Rep, but at less than half the price it's the bar that delivers 80% of the experience for under $200. CAP sells it as part of its Pro Series, which is why the listing headline says Pro Series; the linked option is The Beast in black and chrome with no center knurl.
$149.00checked Oct 17, 2026Buy on Amazon - Plates
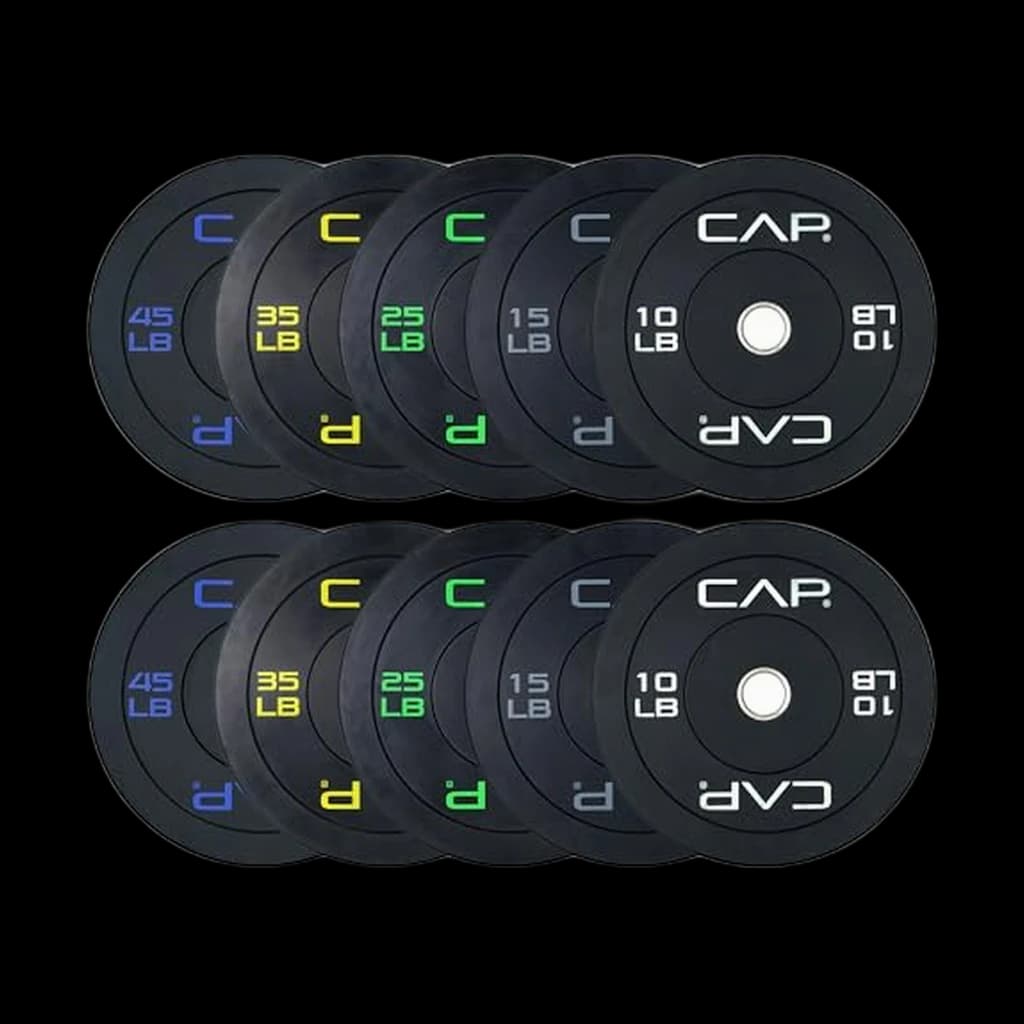
A complete bumper set in one box, sold by Amazon: CAP's Economy 2-inch Olympic bumpers in the 260 lb set, rubber plates on a steel hub. It is the step for a lifter who wants every plate on day one rather than building pair by pair, and it buys the whole set for less than most brands charge for the heavy pairs alone. It is an economy training bumper, not a competition disc: the listing does not publish a weight tolerance, so expect plates that are close to, not exactly, their label.
$259.99checked Oct 22, 2026Buy on Amazon - Rack
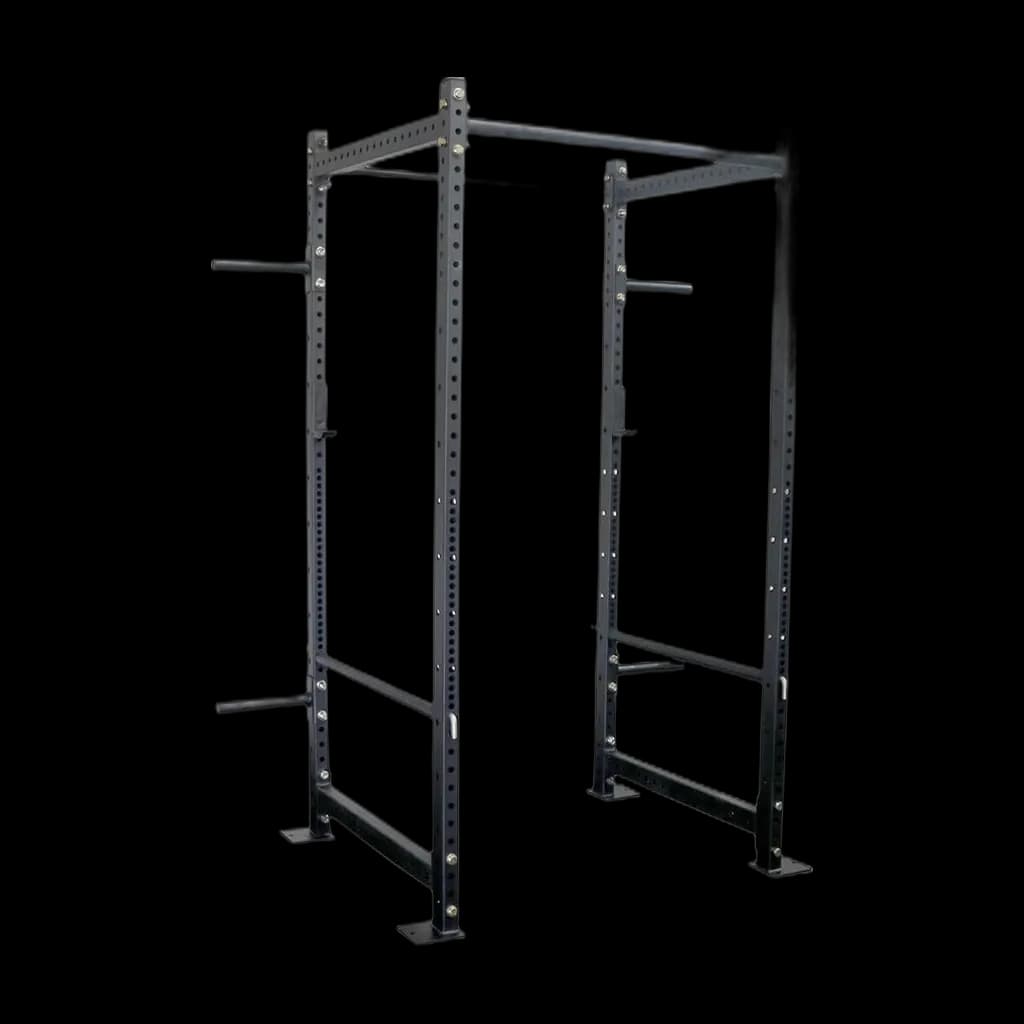
The budget benchmark for power racks. Imported 2x3" steel, fewer accessories than Rogue or REP, but the entry point for thousands of first-time home gym builders. Sold by Titan's own store; fewer than 50 reviews on this variant (5.0 from 5 ratings, 2026-10-21).
$559.99checked Oct 17, 2026Buy on Amazon
Compare the full rankings: barbells & bumper plates, power racks and weight benches. Planning the whole room? The home gym planner fits a rack, bench and plates to your floor space.
One rep max FAQ
How do you calculate your one rep max?
- Multiply the weight you lifted by a rep factor from a prediction formula. Epley's is weight × (1 + 0.0333 × reps), so 225 lb for 5 reps estimates about 262 lb; Brzycki's formula gives about 253 lb and Lombardi's about 264 lb for the same set.
Which 1RM formula is the most accurate?
- No single formula wins for everyone. Mayhew et al. (1995) found Brzycki the most accurate of six equations for bench press sets of 10 reps or fewer, and suggested that averaging two equations may reduce the error, which is why this calculator shows all three and their average.
How accurate is a one rep max calculator?
- It depends mostly on the reps. Whisenant et al. (2003) found the equations more valid when fewer reps were completed, and Mayhew et al. (1995) found every equation they tested over- or under-predicted 1RM for sets of more than 10 reps, so a set of 3 to 10 reps gives the best estimate.
How many reps can you do at 80% of your 1RM?
- The NSCA Training Load Chart puts 80% of 1RM at about 8 reps, 85% at 6 and 75% at 10. It is an average: Richens and Cleather (2014) found endurance runners did far more reps at 70% and 80% of 1RM than weightlifters did.
Can I use the same calculator for squat, deadlift and bench press?
- Yes, the formulas are the same for every lift; the lift picker only changes the starting example and labels. The validation studies cited here tested the bench press (Mayhew, Whisenant) and machine exercises (Beia et al. 2024), so treat squat, deadlift and overhead press estimates as estimates too.
How do you work out plates per side?
- Subtract the bar from the total and halve what is left. 225 lb on a 45 lb bar is 90 lb per side, which is two 45 lb plates; the calculator does this with only the plates you tick and tells you the nearest load if the exact weight is not possible.
Sources
Last checked: . Each page below was opened and read; the equations are copied as those papers tabulate them.
- Lin TY, Hsieh SS, Chueh TY, Huang CJ, Hung TM. The effects of barbell resistance exercise on information processing speed and conflict-related ERP in older adults. Sci Rep. 2021;11:9137 (Table 1, prediction equations from LeSuer et al. 1997): Epley, Brzycki and Lombardi equations as tabulated
- Beia R, Wassermann A, Raps S, Mayhew J, Uder M, Kemmler W. Developing Accurate Repetition Prediction Equations for Trained Older Adults with Osteopenia. Sports (Basel). 2024;12(9):233 (Table 1): Brzycki and Epley equations and their original citations
- Mayhew JL, Prinster JL, Ware JS, Zimmer DL, Arabas JR, Bemben MG. Muscular endurance repetitions to predict bench press strength in men of different training levels. J Sports Med Phys Fitness. 1995;35(2):108–113: Accuracy at 10 reps or fewer vs more than 10; averaging equations
- Whisenant MJ, Panton LB, East WB, Broeder CE. Validation of submaximal prediction equations for the 1 repetition maximum bench press test on a group of collegiate football players. J Strength Cond Res. 2003;17(2):221–227: Validity higher when fewer reps are completed
- NSCA Training Load Chart (National Strength and Conditioning Association, 2012; adapted from Landers 1984): Max reps to %1RM column and the %1RM training table
- Richens B, Cleather DJ. The relationship between the number of repetitions performed at given intensities is different in endurance and strength trained athletes. Biol Sport. 2014;31(2):157–161: Reps at a given %1RM vary with training background; the origins of Epley's chart
Original formula publications, cited as the papers above cite them (a coaching chart, a practitioner article and a textbook; none is freely available online, so we have not linked them): Epley B. Poundage Chart. Boyd Epley Workout. Lincoln, NE: Body Enterprises; 1985. · Brzycki M. Strength testing: predicting a one-rep max from reps-to-fatigue. J Phys Educ Recreat Dance. 1993;64(1):88–90. · Lombardi VP. Beginning Weight Training. Dubuque, IA: W.C. Brown; 1989.
This is a strength-training calculation only. It gives estimates for programming and plate loading; it isn't medical or injury advice.
Hilly Shore Labs
Editorial teamThe independent product research team behind GymScored. Every recommendation is researched, never hands-on tested — recommendations draw on manufacturer specifications and available published research. Category order is editorial; the Gym Score is a separate comparison aid.
170 listed products across 26 home gym categories. Scores use category criteria, value and owner-rating inputs; missing evidence limits what a score can tell you.
See the scoring methodology and who we are.